Ortholog conservation:
Conservation of the residue is assessed within a set of ortholog sequences (i.e. the same protein in different species). These alignment are very useful to highlight important (conserved) or variable position. The more the position varies, the less the variant is likely to have an impact on the protein function. This said, the software provides several figures that can help in interpretation:
- Alignment average percentage identity (AAPI), calculated thanks to Bioperl, represents the vicinity of the different sequences of the set. Be careful with the non-mammals sequences, speciation arose a long time ago!
- Alignment average percentage identity of the region (AAPIR), calculated on 20 residues around the position of the variant (10 upstream and 10 downstream), can highlight highly or poorly conserved regions. AAPIR appears colored if its value is 10% greater or lower compared to AAPI.
- Number of sequences, and divergences. The more sequences the alignment contains, the more information you can extract. Divergences are crucial, see if the residues share common properties (polarity, size...) with the wild-type or with the mutant residue (Venn diagramm can help).
- If you find the mutant residue in the ortholog alignment, especially in a mammal species, be cautious, but your variant is very likely not to alter the protein structure (but don't forget splicing!).
- Conservation focuses on the wild-type residue, conservation - gap is the same figure, but here, the gaps are not taken into account.
- AAPIRs have been calculated for the whole alignments. The graphs represent:
- blue, the local conservation. The following rules have been applied:
- protein size < 500 residues (clarin-1, sans): the local conservation has been calculated at each position using a segment of ten residues.
- 501 residues > protein size < 3000 residues (harmonin, whirlin, protocadherin 15, myosin VIIa): the local conservation has been calculated at each position using a segment of twenty-five residues.
- protein size > 3001 residues (cadherin 23, usherin, vlgr1): the local conservation has been calculated every twenty position using a segment of fifty residues.
- red, the global AAPI.
- Protein pictures have been plotted in order to allow identification of over-conserved domains,...
- blue, the local conservation. The following rules have been applied:
- Informativity of the ortholog alignments:
Gene substitutions / positions P0 MYO7A 4.20 0.0150 USH1C 3.16 0.0425 CDH23 3.13 0.0438 PCDH15 4.86 0.0077 USH1G 3.80 0.0224 USH2A 5.67 0.0034 VLGR1 5.37 0.0047 WHRN 4.12 0.0162 USH3A 4.83 0.0079
The "substitutions / positions" column is calculated with the Homo sapiens sequence as reference. "In general, if a PMSA (Protein Multiple Sequence Alignment) contains > 3.0 substitutions/positions, then the probability that any amino acid will be invariant is < 5%.", Tavtigian et al., 2008 (7), i.e. the probability is < 5% that a position is invariant by chance. This probability is calculated in the P0 column, as described in Greenblatt et al., 2003 (8). For example, if your position of interest is invariant in the myosin VIIa alignment, that means that it has a probability of 0.0150 to be invariant by chance, or a probability of 1 - 0.0150 = 0.9850 (98.50%) to be invariant because it is actually functionally constrained. However, that does not mean your variant is 100% pathogenic, but this is a good clue.
Please consider that the probability calculated for protocadherin 15 is a little bit optimistic. Indeed, some ortholog sequences do not represent isoform CD3, which has been taken as reference. Therefore, the C-terminal part of theses sequences have been removed and replaced by gaps, and, in the P-value calculation, gaps account for variation. However, different tests have shown that the actual value should not be significantly different and may be around 0.01. - Venn diagram of the alignment. Wild-type residue is shown in green, mutant in red or purple if found in the alignment, and other residues are shown in orange if they appear in the alignment. Size of the letters depends on the presence in the alignment: the less the residue is found, the smaller the letter is. Light-grey residues have not been found in the alignment. Their size corresponds to a 100% size. If the mutant residue is small and red, it has not been found (0%). If it is purple, it has been found and its size represents its percentage in the alignment. This shows physico-chemical properties of the different residues involved.
- To help in interpretation, a phylogenetic tree build with the alignment is provided, such as a WebLogo(14).
Domain conservation:
If your wild-type residue belongs to an identified domain, and if we possess an alignment of this domain with other domains of the same type, belonging to different proteins and to different species, then you will find an analysis of this alignment. This kind of alignments are useful to determine structurally crucial residues.
- Alignment Average Percentage Identity of the Domain (AAPID), similar to AAPI but focused on the domain. Amino-acid positions are indicated.
- Alignment Average Percentage Identity of the Region (AAPIR), calculated on 20 residues around the position. This allows to highlight highly conserved domain regions. AAPIR appears colored if its value is 10% greater or lower compared to AAPID.
- Number of sequences, and divergences. In this case, as often we have a high number of sequences, you will probably find several alternative residues. Residues present in more than 10% of sequences are highlighted in blue.
- It is also sometimes useful, when your protein contains several repeats of the same type of domain, to assess conservation within these domains.
- Venn diagram of the alignment and WebLogo. See "ortholog conservation".
- Display complete alignment: the alignment can be downloaded and studied with an alignment viewer such as Jalview.
secondary structure analysis:
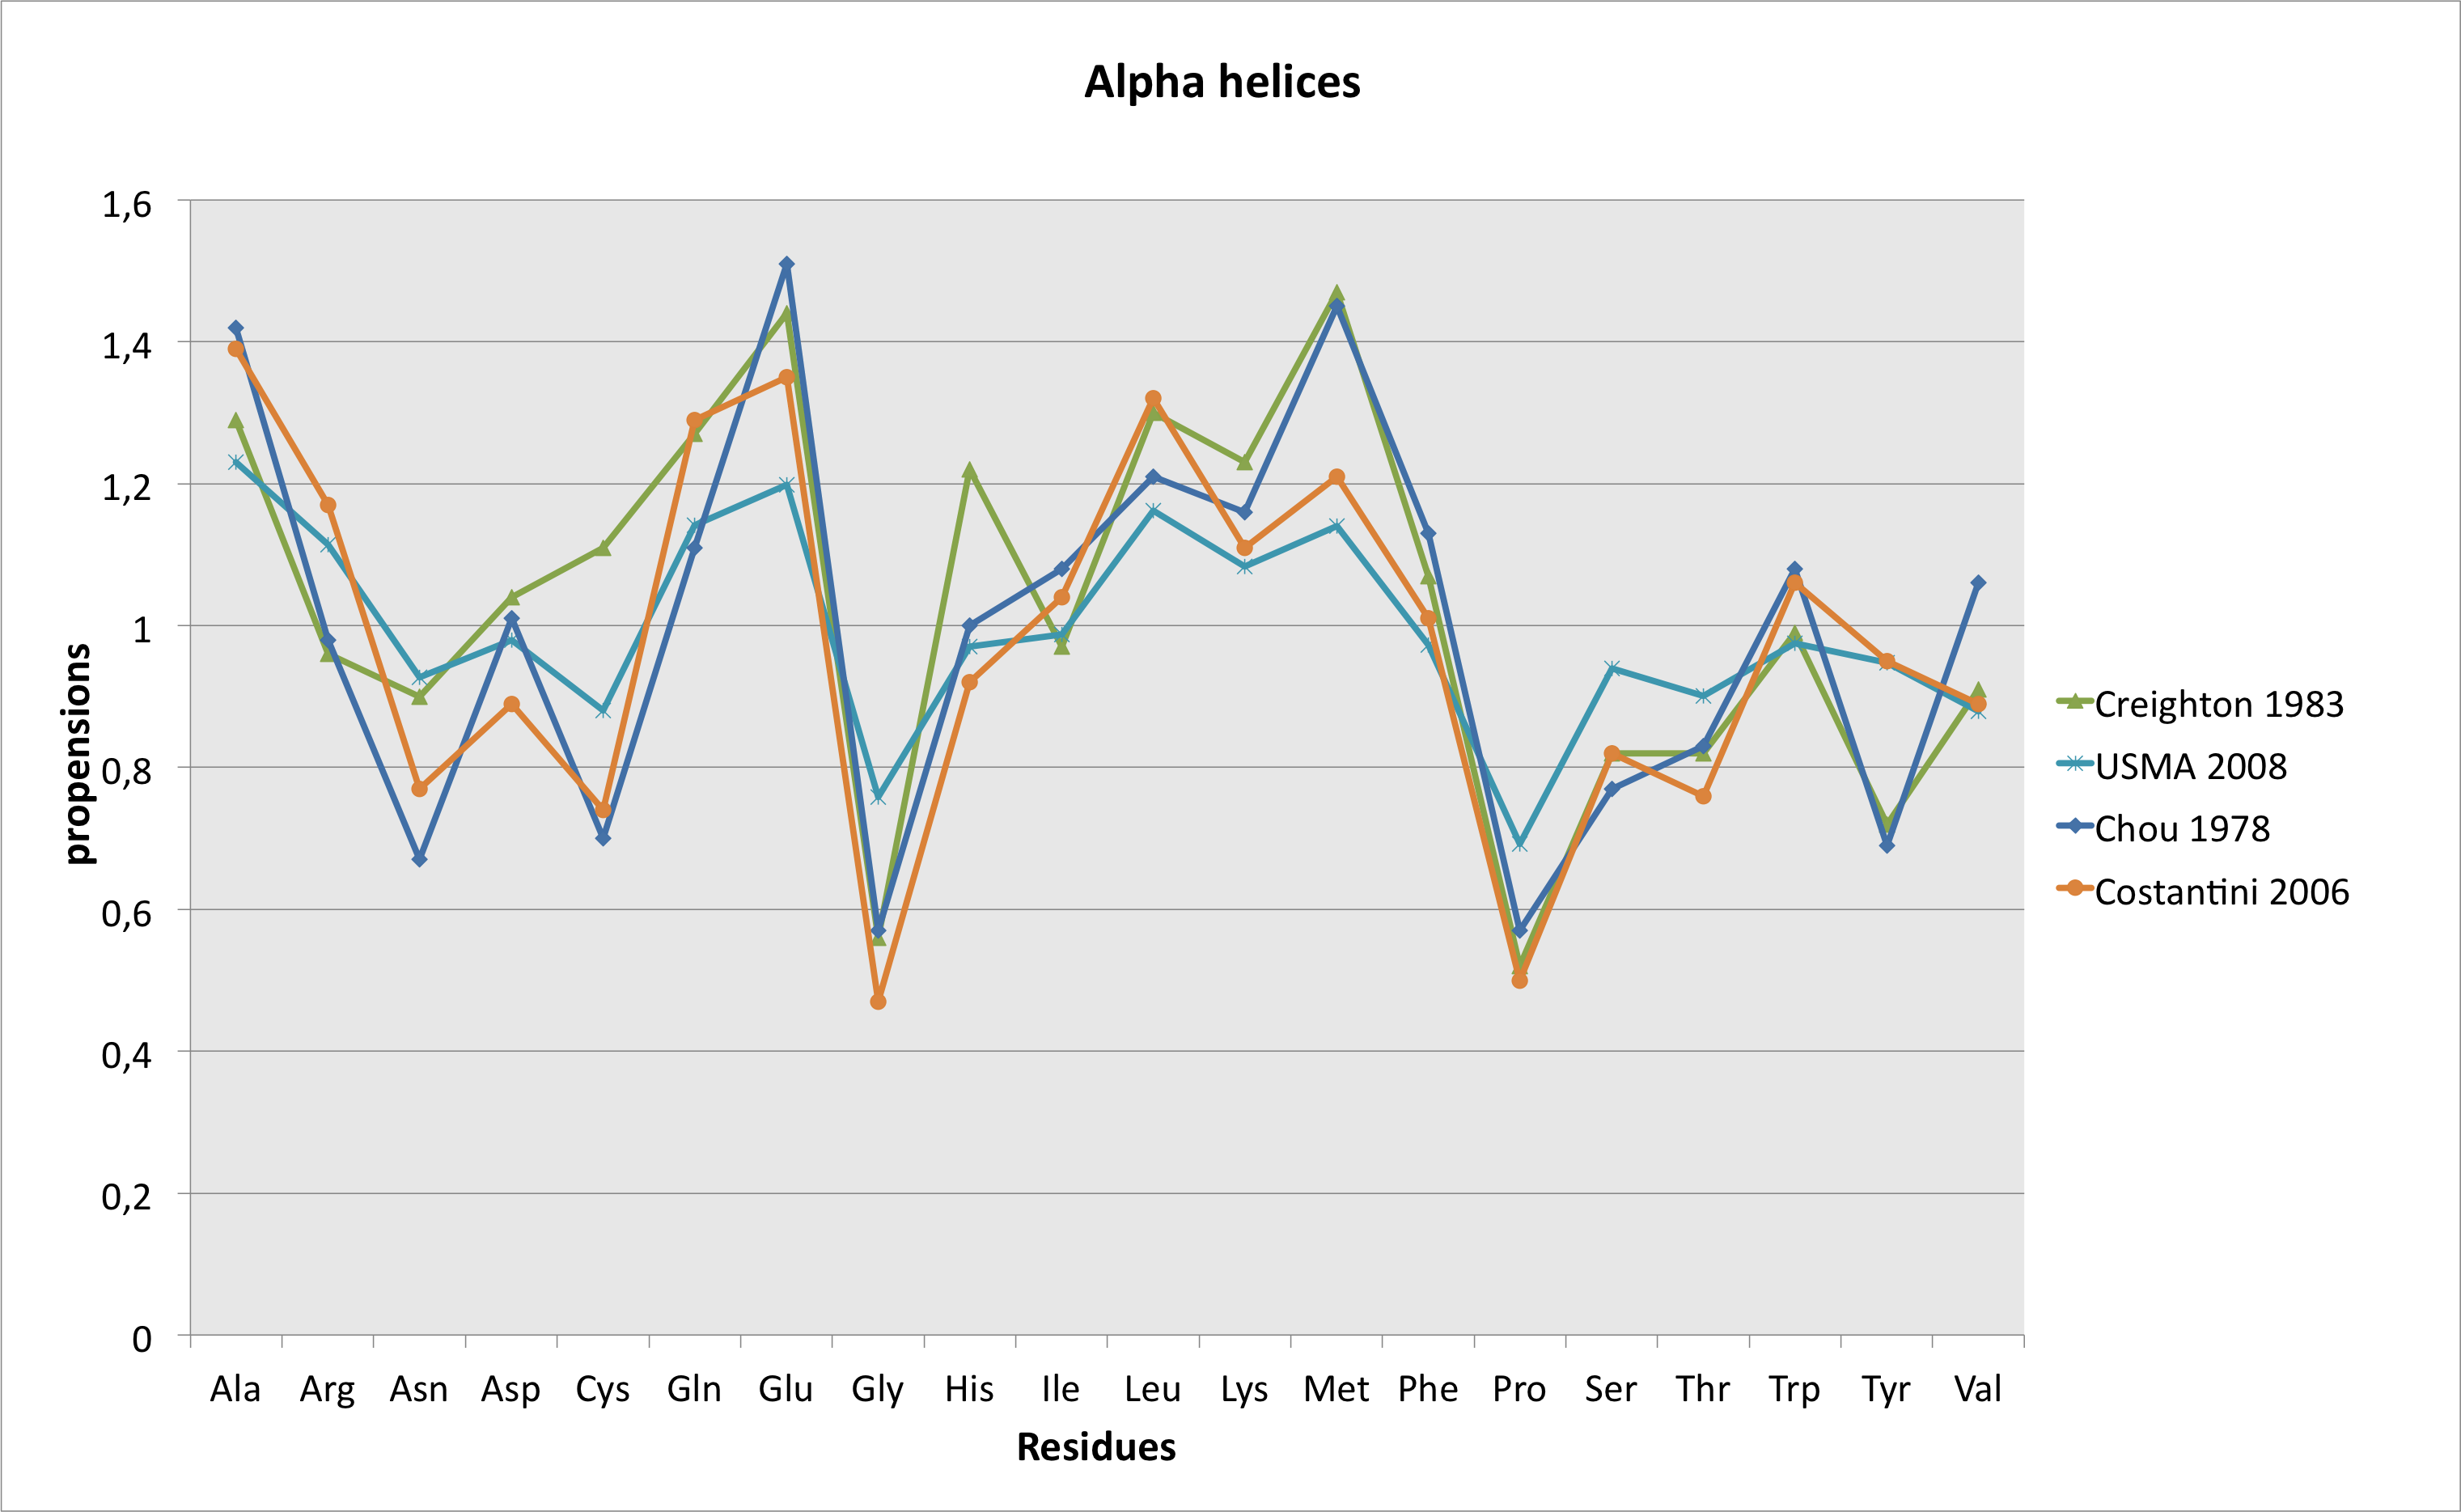
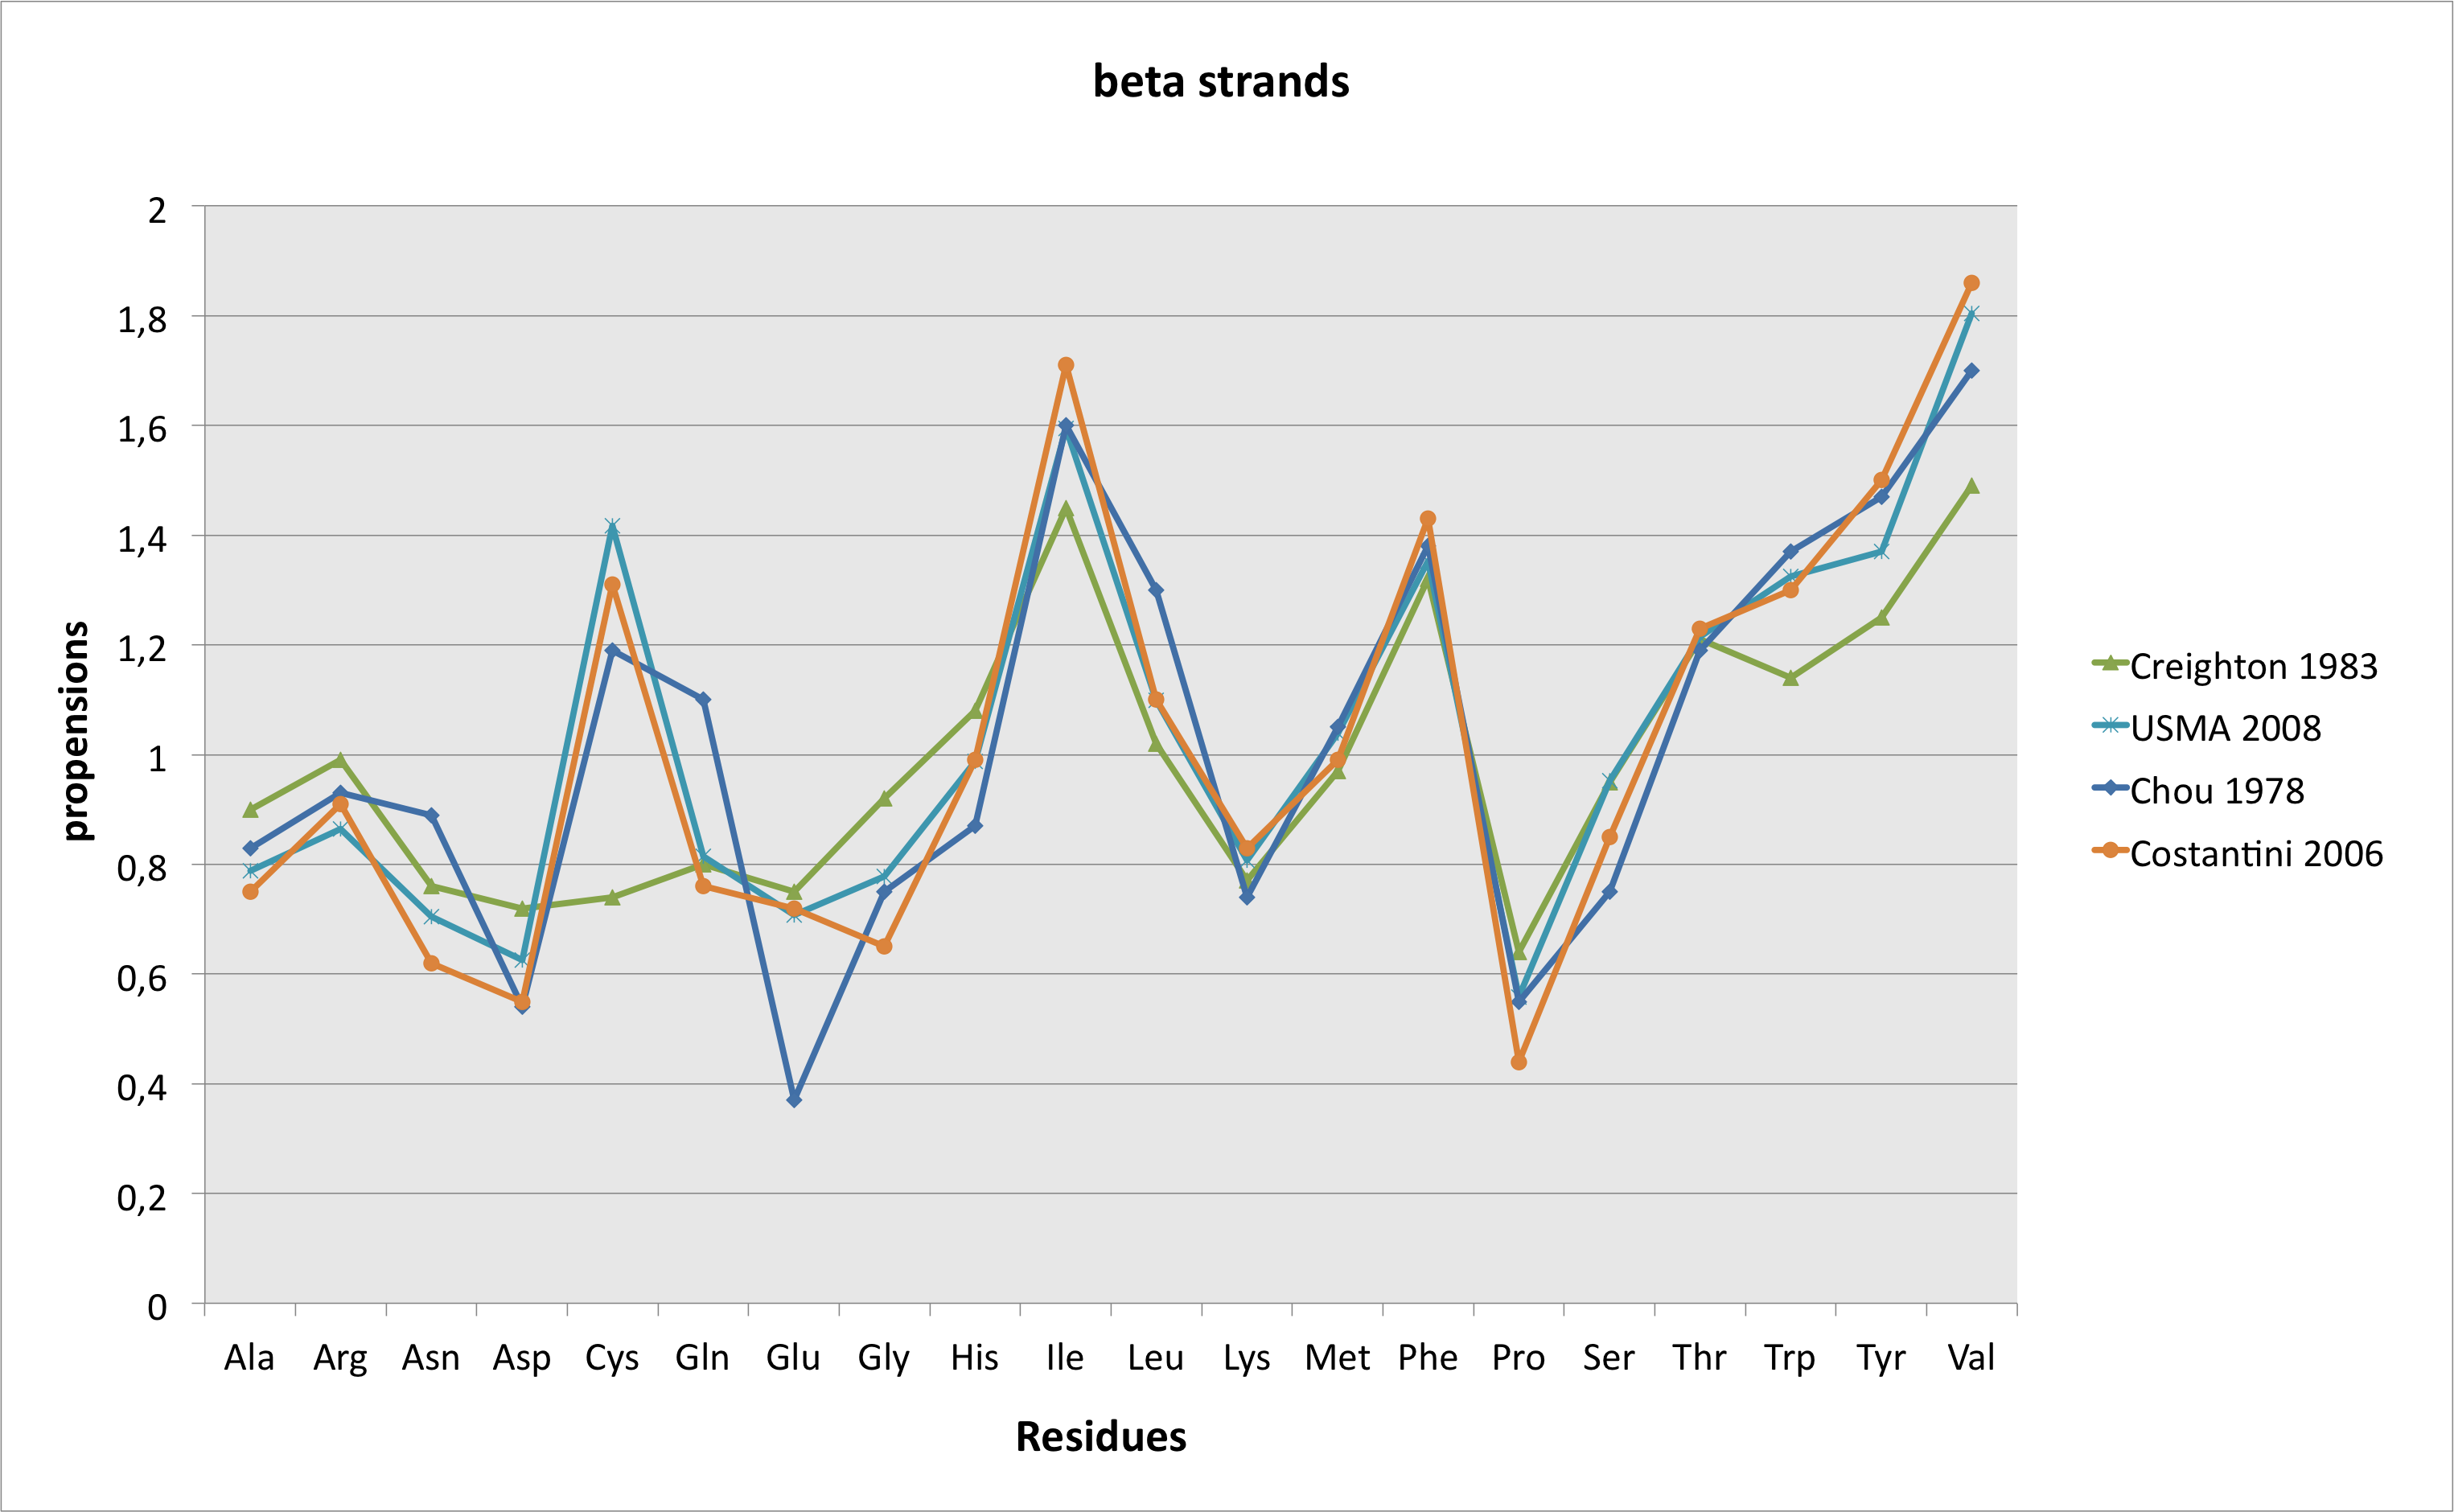
As written in the "methods" part, predictions have been made with PsiPred, version 2.5. The output of the software is a "three-state" result, i.e. the residue is part of an α helice, of a β strand or none of these, and a probability associated to the predicted state. if the residue belongs to an helice or to a strand, "observed frequencies" of the wild-type and mutant residues in this state are displayed. These frequencies have been calculated on a set of 8,365 3D structures, representing 1,598,587 residues, extracted from a set of 14,550 non redondant (< 90% identity) structures, available here. Annotated representative structures presenting a resolution < 2.5 Å have been taken into account, and helices of less or equal to 3 residues and strands of less or equal to 2 residues have been eliminated. Then, frequencies have been calculated on the basis of the pdb structure files annotations, following the Chou-Fasman(10) method of calculation. The graphs displayed below are a comparison of these results with those obtained by Chou and fasman in 1978(11) , Creighton in 1983(12), and more recently, by Costantini et al. in 2006 (using a set of 2,216 structures)(13).